
-
AuthorPosts
-
06/06/2018 at 3:54 AM #4837
fleeting
ParticipantHi,
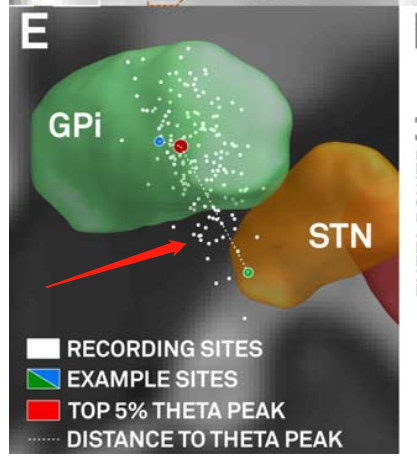
I want to add some recording sistes on to the image like below:
I look over the manual and it seems MER analysis can do this job?
the manual says mark a recoding site using keyboard shortcuts, but I can’t add any marker on it, there wasn’t any reaction.
Is there any one know how to handle it ?
Thanks in advance!Best,
Hao06/06/2018 at 8:00 AM #4840andreashorn
KeymasterHi Hao,
the MER tool does add bubbles e.g. when pressing the space bar. It only reacts when you’re in the main window (i.e. click on the main window first, then move around the trajectories and press space).
You need to activate keyboard control for one of the trajectories in the MER viewer, first, however.This being said, I think it’d be much easier for you to plot the points manually (e.g. using plot3() function). The Lead-DBS Viewer is nothing but a Matlab figure, so you can add anything you want to it using the normal Matlab commands.
Finally, the coordinates in the figure you sent were plotted with lead group (use color points by regressor, set the regressor to all ones and instead of plotting electrode trajectories, plot point clouds).Hope this helps!
Best, Andy
06/06/2018 at 12:39 PM #4842ParticipantHi Andy,
It really helps me to know what to do and how to do!
Thanks a lot!
Best, Hao
06/13/2018 at 2:25 PM #4901ParticipantHi Andy,
Sorry to trouble you again. You said the MER tools only react on main window, but I confused which one is main window, the matlab command window or the 3D scene or any other? My MER control interface is showed below:
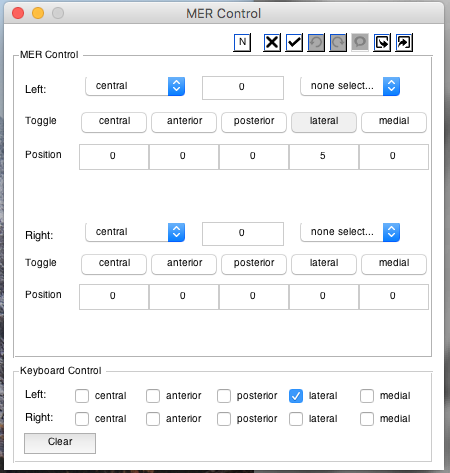
When I clicked on the 3D scene and typed spacebar, it jumped to the matlab command window and typed a space and nothing changed on the 3D scene. Could you tell me how to use it?
Thanks!
Bese,
Hao06/14/2018 at 2:38 AM #4904ParticipantHi Andy,
Sorry to trouble you again. You said the MER tools only react on main window, but I confused which one is main window, the matlab command window or the 3D scene or any other? My MER control interface is showed below:
When I clicked on the 3D scene and typed spacebar, it jumped to the matlab command window and typed a space and nothing changed on the 3D scene. Could you tell me how to use it?
Thanks!
Best,
Hao -
AuthorPosts
- The forum ‘Support Forum (ARCHIVED – Please use Slack Channel instead)’ is closed to new topics and replies.